- Home
- Sustainability Initiatives
- Climate change
Initiatives on Behalf of the Environment
- Climate change
- Conservation of water resources
- Reduction of waste and management of hazardous substances
- Promoting renewable energy
- Promotion of wall greening and rooftop greening
- Cooperation with tenants
- Improvement in effectiveness in cooperation with property managers
- Consideration in real estate investment
- Sustainability certification
Approach to climate change
With the globalization of economic activities and the effects of population growth, various environmental issues such as climate change are growing more serious. At the Parties to the United Nations Framework Convention on Climate Change held in 2015 (COP21), the Paris Agreement was adopted, representing an agreement to keep the rise in average temperatures since the Industrial Revolution to well under 2ºC, and to aim for keeping the rise to 1.5ºC. In 2021, the Japanese government declared the goal of reducing greenhouse gas (GHG) emissions by 46% (compared with 2013 levels) by 2030, and announced that it would further endeavor to reduce GHG emissions by 50%.JPR recognizes that climate change will have a significant impact on its business, including tenant and supply chain activities, and has adopted a policy of contributing actively to the reduction of GHG emissions.
Countering climate change
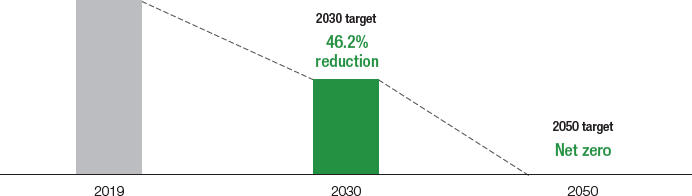
In addition to identifying “countering climate change” as a material issue, we have set medium to long-term targets with a scientific basis, such as “46.2% reduction in total GHG emissions (compared to 2019) by 2030” and “net zero CO2 emissions by 2050. ”JPR works to reduce the impact of its business activities on climate change by reducing GHG emissions through the efficient use of energy in its office buildings, etc., and use of renewable energy. We also believe that the management of real estate with superior energy conservation will lead to the creation of business opportunities and improve competitiveness, and will therefore continue to engage in these initiatives.
GHG emission reduction targets
Support for TCFD
TRIM announced its support for the recommendations of the TCFD (Task Force on Climate-related Financial Disclosures), established by Financial Stability Board (FSB), in May 2021, and is engaged in activities as a member of the TCFD Consortium.
TRIM conducted an analysis of climate change risks and opportunities based on the four core pillars (governance, strategy, risk management, and metrics and targets) of the TCFD recommendations, and is actively disclosing details of those initiatives.

Acquired Certification from Science Based Targets Initiative (SBTi)
JPR established greenhouse gas reduction targets by 2030 and 2050, and as those targets are deemed to be consistent with the level required by the Paris Agreement (aiming to hold the global average temperature increase to a level well below 2℃ above pre-industrial levels and purse efforts to limit the temperature increase to 1.5℃ above pre-industrial levels), and based on scientific grounds, JPR acquired certification from SBTi in April 2023.
SBTi is an international initiative jointly managed by CDP, United Nations Global Compact (UNGC), World Resources Institute (WRI) and World Wide Fund for Nature (WWF) that supports the setting of emission reduction targets based on scientific grounds and certifies them for companies to achieve the target of limiting the rise in global average temperature caused by climate change to 1.5℃.

Governance
TRIM has established the Sustainability Committee in accordance with its Sustainability Regulations. Chaired by the President and CEO of the company, the committee meets four times every year, in principle. Activities of the Sustainability Committee include deliberation on basic policies, monitoring activities, and the establishment of system for promoting sustainability.
Strategies
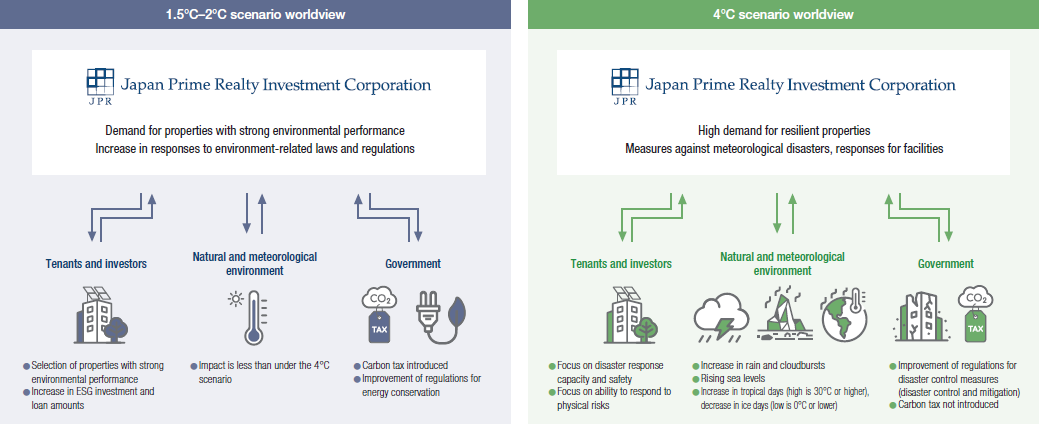
JPR has conducted multiple scenario-based analyses to understand the risks and opportunities of climate change and to examine their impact on its business.
Scenario analysis
Identification of risks and verification of financial impact
In its scenario analysis, JPR identified the following risks and opportunities by utilizing the knowledge of external consultants and quantitatively evaluated the degree of impact, and is responding together with the relevant departments in charge.
Identification of risks and verification of financial impact
| Type of risk | Risk that was identified | Financial impact | Time span | Level of impact | Strategies | ||
|---|---|---|---|---|---|---|---|
| 1.5/2°C | 4℃ | ||||||
| Transition risks |
Policy and regulations | Increase in operation costs resulting from the introduction of a carbon tax | Carbon tax imposed under tightened environmental laws and regulations leads to an increase in the risks surrounding the operations of owned properties. | Medium to long |
High | High |
|
| Market | Cost increase resulting from the increase of energy prices | Rising fossil fuel prices lead to an increase in the unit price of electricity, etc., leading to an increase in operating costs. | Short, medium, and long |
High | Middle |
|
|
| Reputation | Loss of tenants due to a delay in taking green building measures | A delay in taking green building measures results in a failure to cater to the needs of companies aiming to achieve carbon neutrality. This leads to a loss of tenants and a loss of fixed-amount income, such as rents and CAM charges. | Short, medium, and long |
High | Low |
|
|
| Reputation | Withdrawal of investors due to a delay in taking green building measures | A delay in taking green building measures leads to financial institutions’ withdrawal from loans and investments, resulting in increased funding costs. | Medium to long |
High | Low |
|
|
| Physical risks |
Chronic physical risks | Increase in energy consumption attributed to chronic temperature increase | Rise in summer temperatures due to climate change leads to an increase in the amount of cooling used, leading to an increase in energy costs. | Medium to long |
Middle | Middle |
|
| Acute physical risks | Increase in repair costs associated with water damage risk | If the risk of water damage due to climate change, such as that caused by typhoons or flooding, increases owned properties may incur water damage, resulting in the generation of repair costs. | Short, medium, and long |
High | High |
|
|
- Risks arising from the transition to a decarbonized society (predictive analysis of carbon taxes and electricity / energy prices)Reference scenario: IEA World Energy Outlook 2019-2020
- Physical risks caused by climate change itself (calculation of the frequency of flooding / flood damage)Reference Scenario: WWF Water Risk Factor
Identification of opportunities and verification of financial impact
| Type of opportunity | Identified opportunities | Financial impact | Time span | Level of impact | Strategies | ||
|---|---|---|---|---|---|---|---|
| 1.5/2°C | 4℃ | ||||||
| Opportunities | Products and services | Increase in rents for green buildings | Tenants are increasingly demanding properties with high environmental performance due to tougher laws and regulations, resulting in an increase of asset value and real estate rental revenues. | Medium to long |
High | Low |
|
Analysis Using CRREM
Outline of CRREM
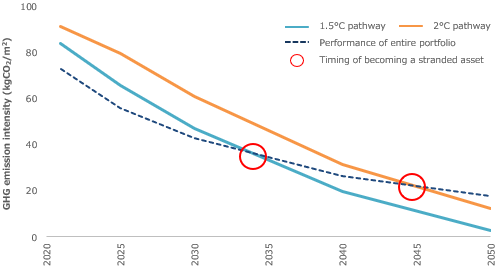
CRREM (Carbon Risk Real Estate Monitor) provides a tool to visualize the risks of retrofitting individual properties and portfolios based on carbon reduction pathways for the 1.5°C and 2°C goals for the reduction of GHG emissions by 2050 in accordance with the Paris Agreement. By comparing data of its properties subject to analysis with the pathways, JPR expects to continue its consideration for determining the timing when individual properties and portfolio will become stranded assets as well as carbon cost, and understanding renovation work and the scale of renewable energy to be introduced, which are needed to accommodate the above.
-
A) Scenario based on the existing energy saving renovation plan
- Scenario reflecting the energy saving renovations that are planned
-
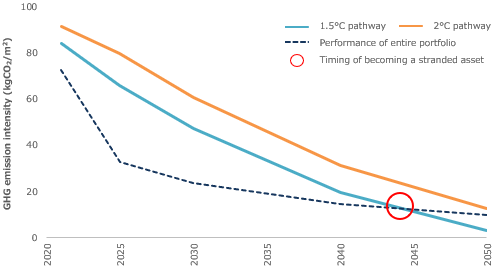
B) Scenario reflecting a renewable energy introduction plan
- Scenario reflecting greater investment in energy saving renovations and a plan for the introduction of renewable energy(Note 1)
Results of analysis using CRREM
JPR conducted an analysis of its properties held (as of December 2021) regarding their risk of becoming stranded assets, using CRREM risk assessment tool (v1.22 Asia-Pacific Region) and CRREM Global Pathways v1.093.(Note 2) Part of the parameters (grid electricity emission factor, carbon prices, etc.) in the tool were adjusted to take into account the circumstances in Japan.
The result of the analysis shows that in Scenario A, pathways to the 1.5°C and 2°C goals will be surpassed around 2033 and around 2044, respectively, and in Scenario B, the pathway to the 1.5°C goal will be surpassed around 2043. Based on the results of the analysis, JPR will consider retrofitting measures and renovations for properties that place significant burdens on the environment, replacing assets and taking other measures.
- In Scenario B, the effects of off-site renewable energy, which is not a requirement in CRREM, are reflected in the property performance.
- As CRREM emphasizes the overall performance of buildings, the consumption of different types of energy, etc. are input for entire buildings or the entire scope of unit ownership, irrespective of the percentage ownership.
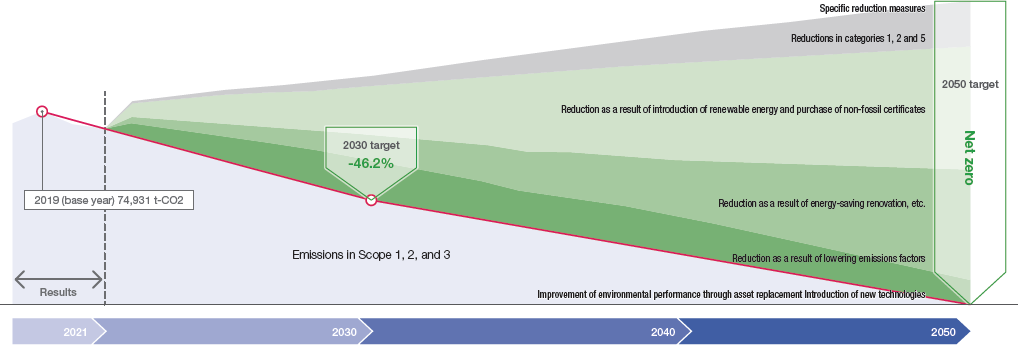
Roadmap to low carbon
JPR has set a 46.2% reduction in total GHG emissions (compared to 2019) by 2030 based on scientific basis regarding GHG emission reductions, and has also set the target of net-zero emissions by 2050. We will formulate specific measures and implement related initiatives to reduce emissions toward achieving these targets.
GHG emission reduction plan
Measures to achieve the plan
JPR is engaged in environmental and energy-saving measures, such as upgrading to highly energy-efficient facilities and improving operating methods, while measuring GHG emission figures to reduce GHG emissions.
Switch of energy suppliers
Review of power comapanies
JPR monitors current CO2 emission factors on a regular basis and is working to reduce GHG emissions by reviewing power supply contracts. We not only make judgments based on CO2 emission factors but also check the evidence, the mix of energy sources and ways to offset our carbon footprint.
Introducing renewable energy sources
Renewable energy is defined as energy that is produced by natural resources and does not produce greenhouse gases. Examples include solar energy, wind energy, geothermal energy, small and medium hydropower, and biomass. JPR is introducing 100% renewable energy contracts while considering increases in energy costs.
Equipment improvement initiatives
Upgrading to highly energy-efficient air-conditioning equipment
Power consumed by air-conditioning equipment represents a significant percentage of the power consumed by the entire building, with power demand increasing sharply during the hot summer months in particular. Air-conditioning equipment is being systematically upgraded to improve economic efficiency and comfort and reduce GHG emissions.
Upgrading to LED lighting
Lighting of exclusive-use areas and common areas are being replaced with LED lighting to reduce power consumption.
Upgrading to lighting fixtures with motion detectors
Motion detectors respond to the movement of people and changes in brightness to provide illumination only when needed, which reduces power consumption preventing people from forgetting to turn off the lights. JPR is working to reduce power consumption by installing motion detectors in restrooms, staff kitchens, and stairways when carrying out common-area renovations so that lights will be turned off when these areas are not in use.
Operational improvement initiatives
| Category | Measure | Key Initiatives |
|---|---|---|
| Lighting | Turning off the lights when rooms are vacant | Creating standards for turning lighting on and off and promoting turning lights off when rooms are vacant |
| Floor management of common-area lighting | Managing lighting of common areas according to use by tenants | |
| Air-conditioning equipment | Changing air-conditioning temperature to recommended values | Recommending that tenants adopt appropriate temperature settings for air-conditioning |
| Turning off air-conditioning power in empty rooms | Turning off air-conditioning equipment power in empty rooms to stop consumption of standby power | |
| Prohibiting entry of outside air during pre-warming/ pre-cooling | Restricting the entry of outside air during pre-warming/pre-cooling in order to reduce air-conditioning loads | |
| Other equipment | Changing contract demand | Reviewing method of operating control equipment for the purpose of reducing contract demand and turning off equipment that is always on standby where appropriate |
| Improving power factor using condensers | Improving power factor through careful control of condensers and reducing electrical circuit and transformer energy loss | |
| Seasonal adjustment of heated toilet seat temperatures | Managing toilet seat heating and washing water temperatures by adjusting the settings according to the season | |
| Seasonal management of times when outdoor lights are turned on | Automatically turning off exterior lights and managing the times when they are lit according to the season |
Improving building resilience
TRIM conducts onsite inspections of all portfolio properties (except land with leasehold interest) at least once a year, in principle, to assess whether they are equipped to withstand disaster (including typhoon, heavy rain, flood, and earthquake), checking for any new risks and seeking to mitigate the risk of damage, loss or degradation of the properties. We are also implementing resilience measures utilizing disaster forecasts, such as regularly checking for hazard map updates in the areas where our properties are located.
Risk management
Risk management
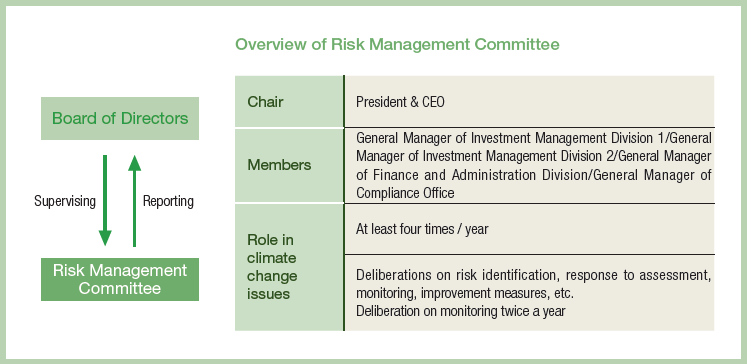
Climate change risks are integrated with risks related to operations and management. They are monitored and managed through multiple verification systems. TRIM has established the Risk Management Committee to improve the effectiveness of its risk management, in accordance with its Risk Management Regulations. This committee deliberates on topics including risk identification, response to assessment, monitoring, and improvement measures. Contents, progress, and results of the committee’s deliberations are reported to the Board of Directors.
The Sustainability Committee also uses a risk monitoring sheet prepared by the Sustainability Secretariat for confirmation.
Risk management process
TRIM monitors all risks—including climate change risks—twice a year, and the Risk Management Committee deliberates on these risks. Details of initiatives taken every year are summarized and plans for the next year formulated at the end of each year are reported to TRIM’s Board of Directors.
Metrics and targets
GHG emission reduction targets
JPR has formulated new GHG emission reduction targets with a view to the 2050 net-zero target, and acquired SBTi certification for these targets as having a scientific basis and being consistent with the levels required by the Paris Agreement. JPR has also set a broader target of reducing total GHG emissions— including Scope 3 emissions—by 46.2% (compared to 2019) by 2030.
| Target | Base year | Target year | Scope of GHG | GHG emission reduction targets |
|---|---|---|---|---|
| Interim target | 2019 | 2030 | Scope 1 + 2 + 3 | 46.2% reduction |
| Long-term target | 2019 | 2050 | Scope 1 + 2 + 3 | Net zero |
Other targets (2030)
| Acquiring environmental certification in the JPR portfolio |
|---|
| Certification acquisition rate of 80% or more, with 4-star/”A” rating or higher |
| Water use per floor area |
|---|
| 10% reduction (compared to 2017) |
| Increasing the percentage of properties rated at specific levels in environmental performance assessments |
|---|
| Rank S or A in the CASBEE Certification for Real Estate |
| Four or five stars in the DBJ Green Building Certification |
| Four or five stars in the BELS certification |
Environmental data (Collection period: January through December)
Some environmental data contained in this report have been assured by LRQA to ensure the reliability of the data reported. The types and values of applicable data are marked with an asterisk (*).
| Category/Unit | FY 2018 | FY 2019 | FY 2020 | FY 2021 | FY 2022 | |
|---|---|---|---|---|---|---|
| Electricity Use* | Total (MWh) | 93,444 | 92,952 | 89,317 | 92,071 | 96,087 |
| Intensity (MWh/㎡) | 0.145 | 0.143 | 0.132 | 0.136 | 0.144 | |
| Gas Use* | Total (MWh) | 17,992 | 17,170 | 16,352 | 15,853 | 17,142 |
| Intensity(MWh/㎡) | 0.028 | 0.026 | 0.024 | 0.023 | 0.026 | |
| Heat Consumption* | Total (MWh) | 12,217 | 12,681 | 14,043 | 14,182 | 14,925 |
| Intensity (MWh/㎡) | 0.019 | 0.019 | 0.021 | 0.021 | 0.022 | |
| Energy consumption* | Total (MWh) | 123,653 | 122,803 | 119,712 | 122,106 | 128,154 |
| Intensity (MWh/㎡) | 0.191 | 0.188 | 0.176 | 0.180 | 0.192 | |
| Water Use* | Total(㎡) | 521,155 | 524,170 | 444,263 | 422,704 | 480,162 |
| Intensity (㎡/㎡) | 0.807 | 0.804 | 0.654 | 0.624 | 0.720 | |
| Scope1* | Total (t-CO2) | 1,369 | 1,331 | 1,293 | 1,212 | 1,233 |
| Intensity (t-CO2/㎡) | 0.0021 | 0.0020 | 0.0019 | 0.0018 | 0.0018 | |
| Scope2* (Market basis) |
Total (t-CO2) | 14,509 | 15,283 | 14,929 | 14,419 | 12,224 |
| Intensity (t-CO2/㎡) | 0.0225 | 0.0235 | 0.0220 | 0.0213 | 0.0180 | |
| Scope1+2* | Total (t-CO2) | 15,878 | 16,614 | 16,222 | 15,631 | 13,457 |
| Intensity (t-CO2/㎡) | 0.0246 | 0.0255 | 0.0239 | 0.0231 | 0.0199 | |
| Scope3* | 55,624 | 58,317 | 54,347 | 53,331 | 47,631 | |
| Category 1* | (t-CO2e) | 5,518 | 5,906 | 5,857 | 5,729 | 5,946 |
| Category 2* | (t-CO2e) | 7,770 | 9,942 | 10,383 | 10,158 | 9,861 |
| Category 3* | (t-CO2e) | 2,988 | 3,098 | 3,279 | 3,245 | 3,267 |
| Category 4* | (t-CO2e) | N/A | N/A | N/A | N/A | N/A |
| Category 5*(Note 1) | (t-CO2e) | 3,128 | 2,894 | 2,001 | 1,979 | 1,968 |
| Category 6* | (t-CO2e) | N/A | N/A | N/A | N/A | N/A |
| Category 7* | (t-CO2e) | N/A | N/A | N/A | N/A | N/A |
| Category 8* | (t-CO2e) | N/A | N/A | N/A | N/A | N/A |
| Category 9* | (t-CO2e) | N/A | N/A | N/A | N/A | N/A |
| Category 10* | (t-CO2e) | N/A | N/A | N/A | N/A | N/A |
| Category 11* | (t-CO2e) | N/A | N/A | N/A | N/A | N/A |
| Category 12* | (t-CO2e) | N/A | N/A | N/A | N/A | N/A |
| Category 13* | (t-CO2e) | 36,220 | 36,477 | 32,827 | 32,220 | 26,589 |
| Category 14* | (t-CO2e) | N/A | N/A | N/A | N/A | N/A |
| Category 15* | (t-CO2e) | N/A | N/A | N/A | N/A | N/A |
- The data shown in the table is based on the data that is available to JPR.
- The energy consumption and scope 1 emissions data does not include relevant data derived from emergency generator fuel.
- Energy consumption, water use and GHG emissions data is also broken down into office property and retail property categories for further verification. The intensity is presented based on the calculation of (Total amount of electric power or CO₂)/(Total floor area of equities (m2) x (Average occupancy rate per year (%))
- The collection period of category 5 is April through March.