Portfolio Summary
Portfolio Overview
as of December 31, 2023
| Number of Properties | Leasable Space | Number of Tenants | Occupancy Rate | NOI yield (before depreciation) | NOI yield (after depreciation) |
|---|---|---|---|---|---|
| 67 | 497 thousand (㎡) | 1,236 | 98.7 % | 4.5 % | 3.6 % |
Portfolio Status
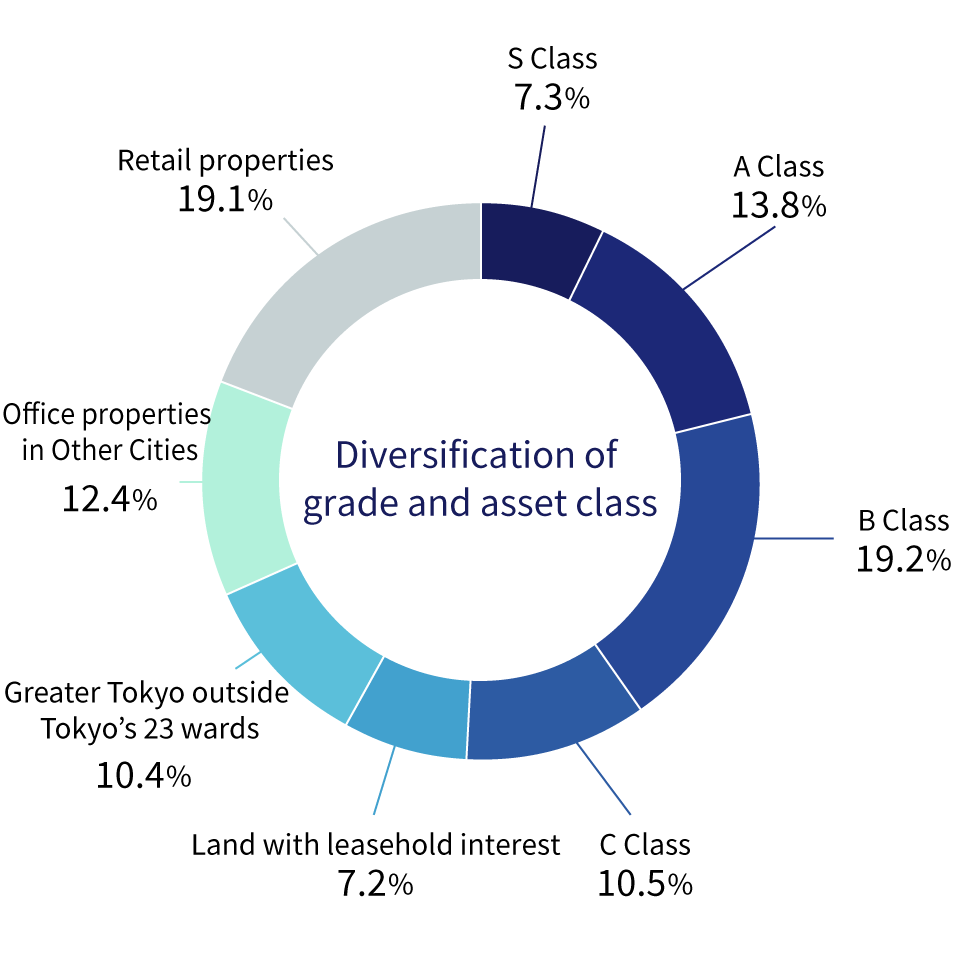
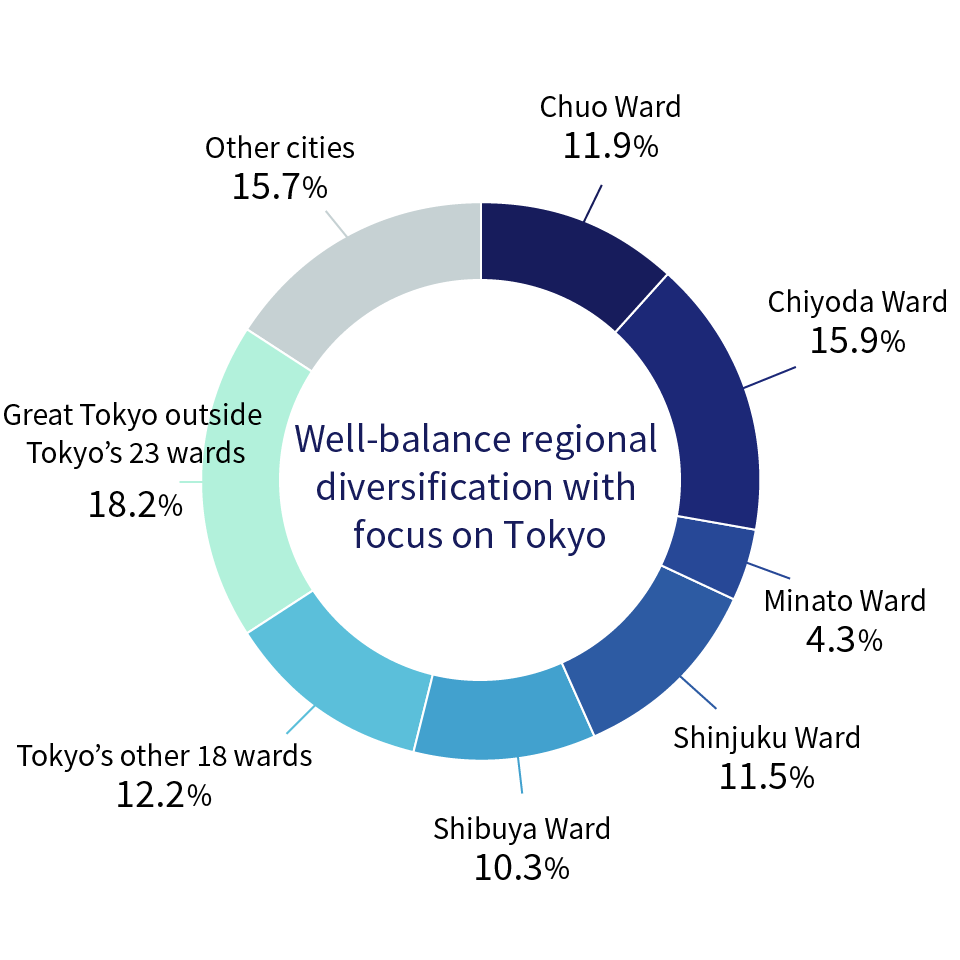
JPR has built a robust portfolio diversified in terms of area, grade, asset class and rent zone, with a focus on excellently located office buildings in Tokyo.
Ratio by grade/asset class (all properties)
Ratio by area (all properties)
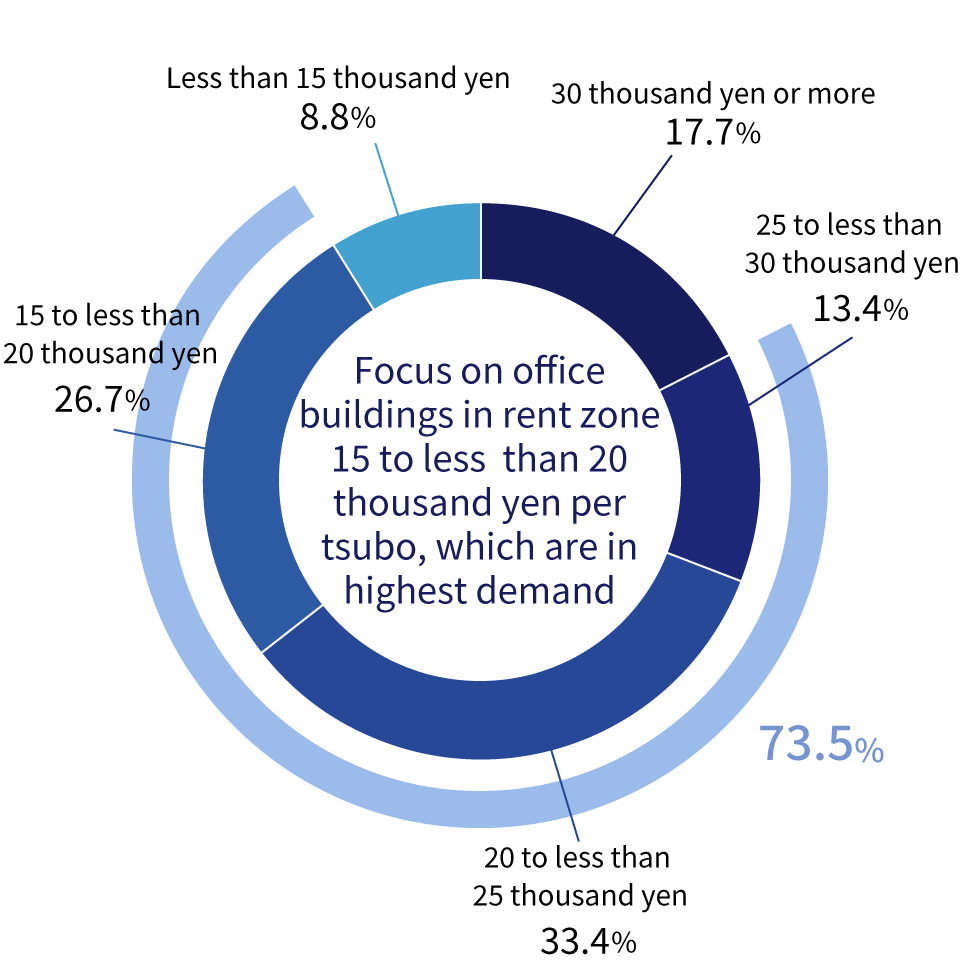
Ratio by Rent Zone (office properties)
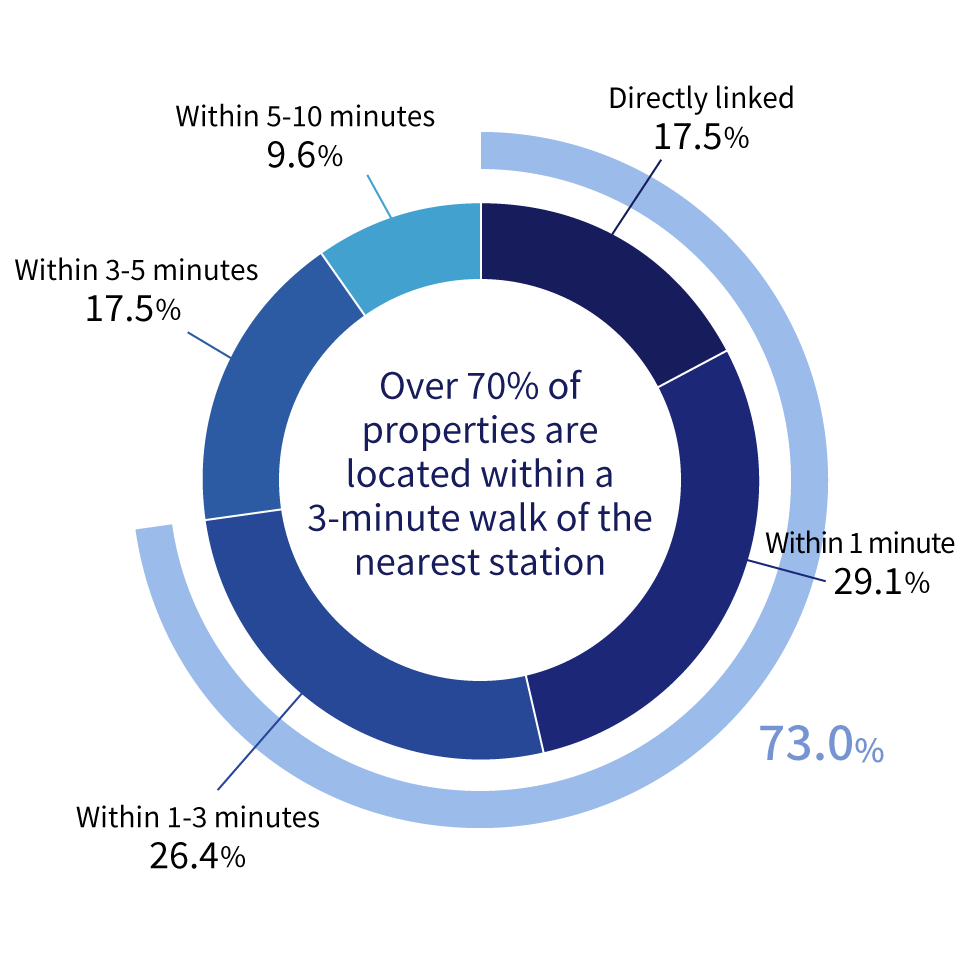
Ratio by number of minutes walk from nearest station (all properties)
- The ratios in the graphs above are calculated based on acquisition prices.
- The ratios are rounded to one decimal place.
- The building class definitions, which are criteria independently set by TRIM, are as follows:
Target area: Tokyo’s 23 wards.
S Class: of the S Class properties below, those that meet the criteria factoring in size, location, age, etc.
A Class: total floor area of 10,000 tsubo or more, area per floor of 300 tsubo or more
B Class: area per floor of 200 tsubo or more
C Class: area per floor of 100 tsubo but less than 200 tsubo - “Ratio by Rent Zone (office properties)” indicates the ratios excluding Grand Front Osaka.
- The portfolio status data indicated above have been partially changed recently. Major events have caused the change is as follows:
・Property acquisitions
Nakano Central Park East : Mar. 1, 2024
10 Largest Tenants
| No | Tenant | Property | Leased Space(㎡) |
% in the portfolio |
|---|---|---|---|---|
| 1 | Tokyo Tatemono Co., Ltd. | Shinjuku Square Tower Shinjuku Center Bldg. Tokyo Square Garden Olinas Tower Kawasaki Dice Bldg. GRAND FRONT OSAKA (North Building) (Note 3) |
50,196 | 10.1% |
| 2 | ABC Development Corporation | Housing Design Center Kobe | 35,444 | 7.2% |
| 3 | Seiyu Co.,Ltd. | Tanashi ASTA | 31,121 | 6.3% |
| 4 | Taisei-Yuraku Real Estate Co., Ltd. | Rise Arena Bldg. Sencity Bldg. |
24,075 | 4.9% |
| 5 | Ito-Yokado Co., Ltd. | JPR Musashikosugi Bldg. | 19,740 | 4.0% |
| 6 | Olympic Group Corporation | Musashiurawa Shopping Square | 9,558 | 1.9% |
| 7 | Mitsubishi Estate Co.,Ltd. | Otemachi Financial City North Tower GRAND FRONT OSAKA (Umekita Plaza and South Building) (Note 3) GRAND FRONT OSAKA (North Building) (Note 3) |
4,191 | 0.8% |
| 8 | Tower Records Japan, Inc. | JPR Shibuya Tower Records Bldg. | 8,076 | 1.6% |
| 9 | Y.K. Tokyo Prime Stage | Otemachi Tower (Land with Leasehold Interest) | 7,875 | 1.6% |
| 10 | Hitachi Real Estate Partners, Ltd. | BYGS Shinjuku Bldg. JPR Ueno East Bldg. Yume-ooka Office Tower JPR Nagoya Fushimi Bldg. |
7,066 | 1.4% |
- The floor space of co-owned buildings corresponding to the portions owned by JPR are indicated.
- The areas are rounded down to the nearest specified unit, and the percentages and other figures are rounded off to the nearest specified unit.
- Leased floor space at end of period for GRAND FRONT OSAKA (Umekita Plaza and South Building) and GRAND FRONT OSAKA (North Building) is not disclosed as no consent to disclosure has been obtained from the co-owners etc, so leased space is not in the table above summing-up.