分配金(一口当たり)
- 確定分配金第44期(2023年12月期)
- 7,600円
- 予想分配金第45期(2024年6月期)
- 7,600円
- 予想分配金第46期(2024年12月期)
- 7,600円
ポートフォリオ
- 保有物件数2024年3月29日現在
- 68物件
- 資産規模2024年3月29日現在
- 5,258億円
- 稼働率2024年2月29日現在
- 98.5%
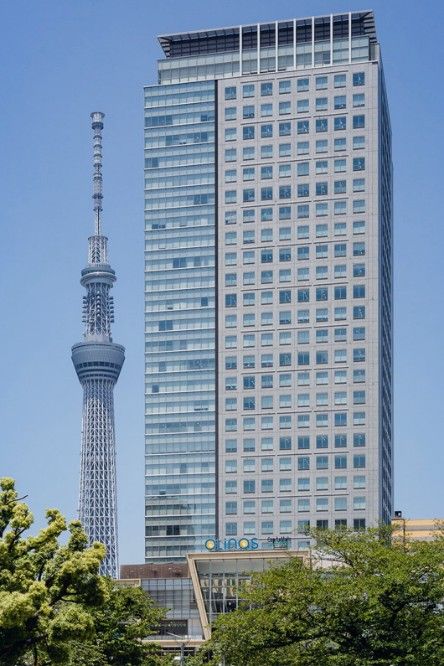
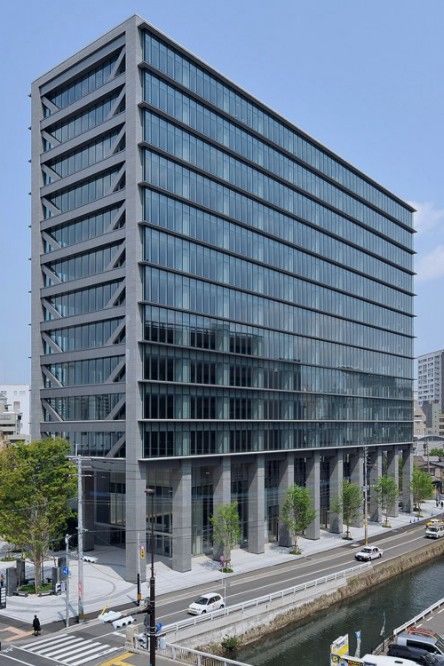
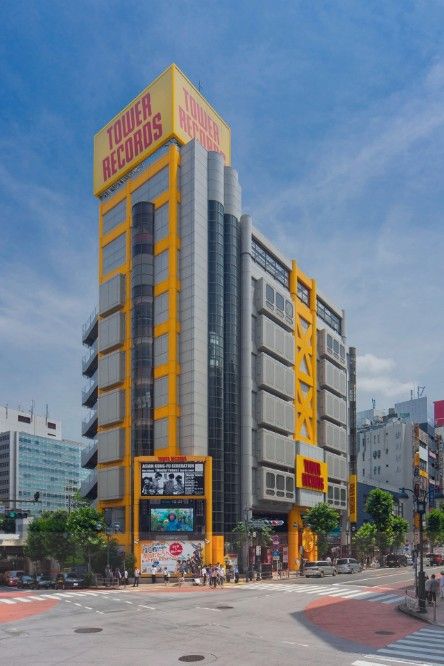
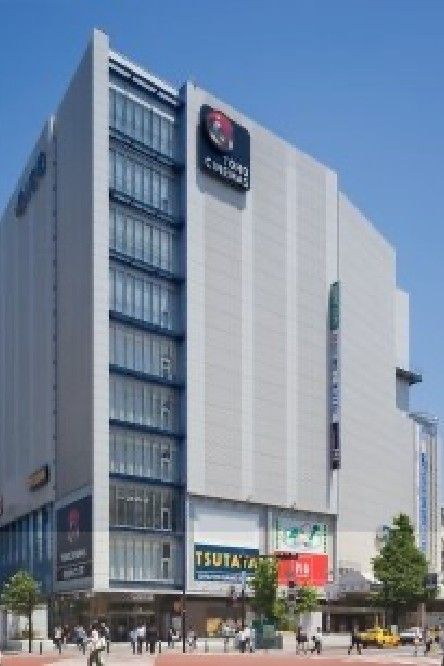
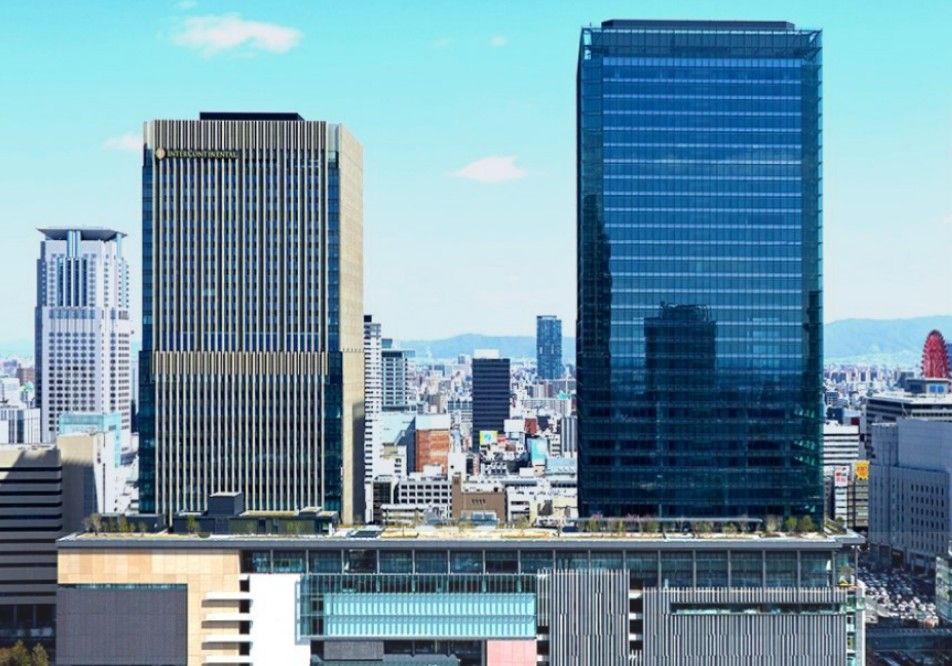
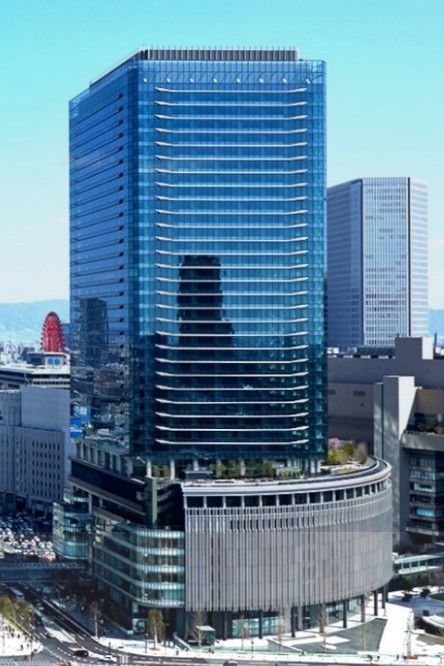
High quality portfolio
日本プライムリアルティ投資法人(JPR)は、東京建物をスポンサーとする、
オフィスと都市型商業施設等による複合型J-REITです。
東京オフィスを中心に、エリア・アセットクラスの分散が効いた
強固なポートフォリオを構築しています。


サステナビリティへの取組み
当社は社会的課題に真摯に向き合い、取り組みを進めることにより、
投資家の皆様の長期リターンの向上を図るとともに、
持続可能な社会の実現と都市の発展に貢献していきたいと考えております。